Problem definition
Estimating Classifications
Estimate classifications are commonly used to indicate
the overall maturity and quality for the various types of estimates that may be
prepared during the life cycle of a project. An understanding of the characteristics
of the different types of estimates is essential before they can be produced
and reviewed. There are variances in terminology
and number from industry to industry. Four types will be addressed here; Conceptual,
Cost estimating is the predictive
process used to quantify, cost and price the resources required by the scope of
investment option, activity or project. Depending on the stage of the project,
three main methods are used to estimate costs. What are the features of the
cost estimating methods
Feasible alternatives
Conceptual Estimate
Preliminary Estimate
Detailed Estimate
Definitive Estimate
Develop the outcome of each
alternative
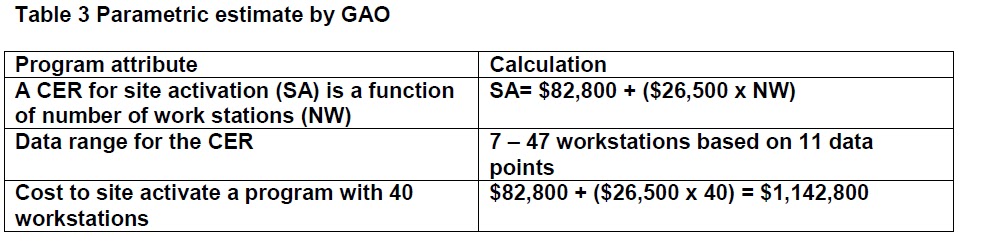
1 Conceptual Estimates
As the name
implies this is the first type of estimate produced at conception stage of the
project. It goes by various names; order-of-magnitude, screening, round table,
blue sky, expert, study and back of the envelope. It provides a relatively
quick method of determining approximate probable cost of a project without the
benefit of detailed scope definition. Table 1 is a conceptual estimate of
building a 1500 room capacity hotel with the cost of an existing 1000 room
capacity hotel known..
Table 1 An example of Conceptual estimate
|
Parameter
|
Existing system
|
New system
|
Cost of new system
(assuming linear relationship)
|
|
Hotel
|
1000
|
1500
|
|
|
Rooms
|
1000
|
1500
|
|
|
Cost
|
$67,500,00
|
X
|
($67,500,000/1000) X
1500 =$101,250,000
|
2 Preliminary Estimates
Preliminary
estimate is prepared after all the engineering decisions have been made. It
reflects project specific information to provide a number tailored to the
particular project at hand. It goes by other names like budgetary estimate or appropriations
estimate. It is used to develop initial budget. At this stage engineering is
10-20% complete and information is available on file like major equipment costs.
In the hotel example of Table 1, the lobby, restaurant, conference rooms,
parking, swimming pool and night club decision have been taken and costed based
on information available.t
3 Detailed Estimates
The detailed
estimate serves as a basis for evaluating development, production, or
construction bids and awarding contracts. This is prepared at the lowest level of
detail of the full account structure. Every component part is identified and
itemised.
4 Definitive Estimates
This is the final and most detailed type of
estimate. This is prepared to establish a detailed baseline for the monitoring
and control during execution phases of the project. This time the design is almost
complete and equipment and material prices are known.
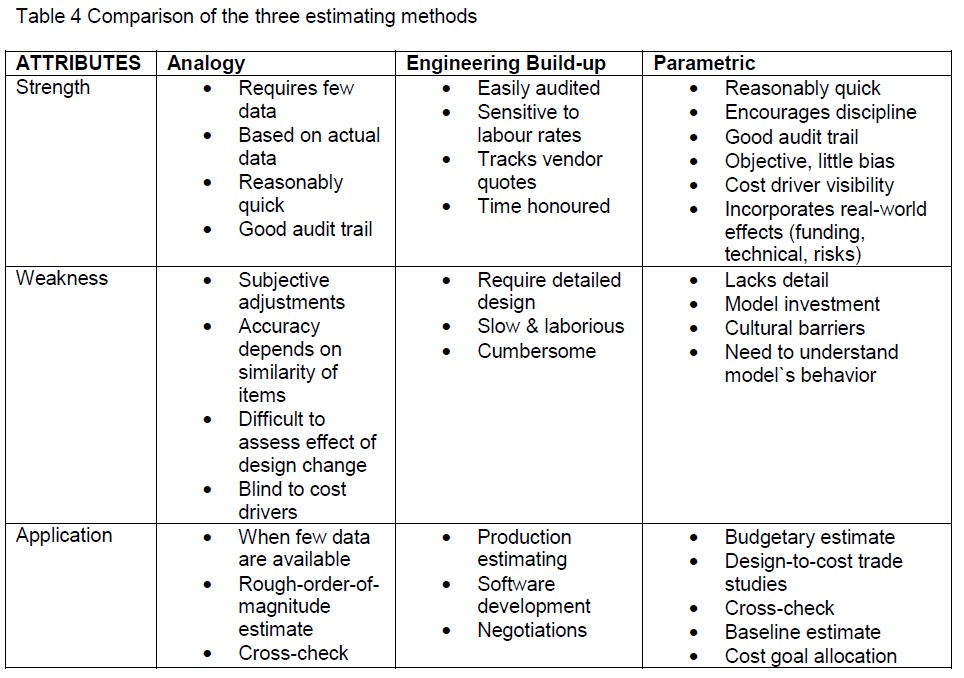
Selection of criteria
The attribute for the selection criteria is;
·
Strength
·
Weakness
·
Application
Analysis of alternatives
Table 2 Comparison of estimate Types
|
ATTRIBUTES
|
Strength
|
Weakness
|
Application
|
|
Conceptual
|
·
Requires few data
·
Based on actual data
·
Reasonably quick
·
Good audit trail
|
·
Least accurate
·
Very risky
·
Cannot be used to award contract
|
·
Studying alternatives
·
Making go/no-go decisions
·
What if studies
·
Rough check to detailed estimate
·
)
|
|
Preliminary
|
·
Reduced cost risk
·
Greater detail available
·
Blind to cost drivers
|
·
Difficult to assess effect of design change
·
Subject to variances
|
·
Initial project budget
·
Documentation of schedule activity duration
·
Variance analysis
|
|
Detailed
|
·
Improved accuracy
·
Scope definition detailed
·
Minimal risk
|
·
Require detailed design
·
Slow & laborious
·
Cumbersome
|
·
Budgetary estimate
·
Design-to-cost trade studies
·
Cross-check
·
Baseline estimate
·
Cost goal allocation
|
|
Definitive
|
·
Improved accuracy
·
Most detailed
|
·
Slow & laborious
·
Cumbersome
|
·
Cost baseline
·
Monitoring & control during execution
·
Variance reporting
·
Productivity analysis
·
Estimate at completion development
|
Selection of preferred alternative
The primary differentiating features that separate the
estimate types are the amount of information and time available to develop them
and the point in the life cycle of the project. The requirement determines
which estimate type to employ.
Performance monitoring and evaluation
Estimate
accuracy improves with time due to advanced engineering/design completion and
amount of time available. It is always necessary to review the estimates with
independent estimates and difference reconciled.
References
Dysert, L. R. Estimating, Skills & Knowledge of Cost
Engineering (5th ed.), (PP 9.1.-9.34) WV, AACE International
Developing a Point Estimate, GAO Cost Estimating and
Assessment Guide (February 2005.), (PP. 107-123) Washington, DC, retrieved from
http://www.gao.gov/cgi-bin/getrpt?GAO-05-325SP .
Humphreys, G. C. (2011). Types of Estimates, Project
Management Using Earned Value (2nd ed.), (PP. 395-399) CA, Humphreys
& Associates Inc.
Project Management Estimating Tools & Techniques,
Project Management Guide retrieved from http://www.projectmanagementguru.com/estimating.html.


