Thursday, February 28, 2013

W13_Ocharlie_Types of Estimates


Problem definition

 Estimating Classifications

Estimate classifications are commonly used to indicate the overall maturity and quality for the various types of estimates that may be prepared during the life cycle of a project. An understanding of the characteristics of the different types of estimates is essential before they can be produced and reviewed.  There are variances in terminology and number from industry to industry. Four types will be addressed here; Conceptual,  Cost estimating is the predictive process used to quantify, cost and price the resources required by the scope of investment option, activity or project. Depending on the stage of the project, three main methods are used to estimate costs. What are the features of the cost estimating methods

Feasible alternatives

Conceptual Estimate

Preliminary Estimate

Detailed Estimate

Definitive Estimate

Develop the outcome of each alternative

1 Conceptual Estimates

As the name implies this is the first type of estimate produced at conception stage of the project. It goes by various names; order-of-magnitude, screening, round table, blue sky, expert, study and back of the envelope. It provides a relatively quick method of determining approximate probable cost of a project without the benefit of detailed scope definition. Table 1 is a conceptual estimate of building a 1500 room capacity hotel with the cost of an existing 1000 room capacity hotel known..

Table 1 An example of Conceptual estimate

Parameter
Existing system
New  system
Cost of new system (assuming linear relationship)
Hotel
1000
1500
 
Rooms
1000
1500
 
Cost
$67,500,00
X
($67,500,000/1000) X 1500 =$101,250,000


2 Preliminary Estimates

Preliminary estimate is prepared after all the engineering decisions have been made. It reflects project specific information to provide a number tailored to the particular project at hand. It goes by other names like budgetary estimate or appropriations estimate. It is used to develop initial budget. At this stage engineering is 10-20% complete and information is available on file like major equipment costs. In the hotel example of Table 1, the lobby, restaurant, conference rooms, parking, swimming pool and night club decision have been taken and costed based on information available.t


3 Detailed Estimates

The detailed estimate serves as a basis for evaluating development, production, or construction bids and awarding contracts. This is prepared at the lowest level of detail of the full account structure. Every component part is identified and itemised.

4 Definitive Estimates

 This is the final and most detailed type of estimate. This is prepared to establish a detailed baseline for the monitoring and control during execution phases of the project. This time the design is almost complete and equipment and material prices are known.

Selection of criteria

The attribute for the selection criteria is;

·         Strength

·         Weakness

·         Application

 Analysis of alternatives

Table 2 Comparison of estimate Types

ATTRIBUTES
Strength
Weakness
Application
Conceptual
·         Requires few data
·         Based on actual data
·         Reasonably quick
·         Good audit trail
·         Least accurate
·         Very risky
·         Cannot be used to award contract
 
·         Studying alternatives
·         Making go/no-go decisions
·         What if studies
·         Rough check to detailed estimate
·         )
Preliminary
·         Reduced cost risk
·         Greater detail available
·         Blind to cost drivers
·         Difficult to assess effect of design change
·         Subject to variances
·         Initial project budget
·         Documentation of schedule activity duration
·         Variance analysis
 
Detailed
·         Improved accuracy
·         Scope definition detailed
·         Minimal risk
·         Require detailed design
·         Slow & laborious
·         Cumbersome
·         Budgetary estimate
·         Design-to-cost trade studies
·         Cross-check
·         Baseline estimate
·         Cost goal allocation
Definitive
·         Improved accuracy
·         Most detailed
 
·         Slow & laborious
·         Cumbersome
·         Cost baseline
·         Monitoring & control during execution
·         Variance reporting
·         Productivity analysis
·         Estimate at completion development


Selection of preferred alternative

The primary differentiating features that separate the estimate types are the amount of information and time available to develop them and the point in the life cycle of the project. The requirement determines which estimate type to employ.

Performance monitoring and evaluation

Estimate accuracy improves with time due to advanced engineering/design completion and amount of time available. It is always necessary to review the estimates with independent estimates and difference reconciled.

References

Dysert, L. R. Estimating, Skills & Knowledge of Cost Engineering (5th ed.), (PP 9.1.-9.34) WV, AACE International

Developing a Point Estimate, GAO Cost Estimating and Assessment Guide (February 2005.), (PP. 107-123) Washington, DC, retrieved from http://www.gao.gov/cgi-bin/getrpt?GAO-05-325SP .

Humphreys, G. C. (2011). Types of Estimates, Project Management Using Earned Value (2nd ed.), (PP. 395-399) CA, Humphreys & Associates Inc.

Project Management Estimating Tools & Techniques, Project Management Guide retrieved from http://www.projectmanagementguru.com/estimating.html.

W12_Ocharlie_Estimate Methods


Problem definition

Cost Estimating Methods

Cost estimating is the predictive process used to quantify, cost and price the resources required by the scope of investment option, activity or project. Depending on the stage of the project, three main methods are used to estimate costs. What are the features of the cost estimating methods?

Feasible alternatives

Engineering build up method

Analogy method

Parametric method

Develop the outcome of each alternative

1 Analogy

The analogy uses actual costs from a similar program with adjustments to account for differences between the requirement of the existing and the new one.


2 Engineering Build-Up Method

The engineering build-up method sometimes called bottom-up method uses the WBS to build costs from the lowest level of details and summing up to get the overall cost. Because of the high level of detail each step of the work flow should be identified, measured, and tracked and the result for each outcome should be summed to make the estimate.

 
3 Parametric Method

A parametric model is a mathematical representation of of cost relationships that provide a logical and predictable correlation between the physical or functional characteristics of a plant (or process system) and its resultant cost. It relies on collection and analysis of data from previous projects to arrive at a cost estimating relationship (CER)

 Selection of criteria

The attribute for the selection criteria is;

·         Strength

·         Weakness

·         Application

 Analysis of alternatives


Selection of preferred alternative

The estimate development process is a logical one. The method to be adopted depends on the amount of available detail for project scope.  Engineering Build-up method is employed for detailed or definitive type estimate, because it relies on the availability of detailed design and scope information. The Analogy and Parametric Methods are used for conceptual estimates because they do not require detailed information. Any or all of the three methods can be used in the preliminary estimate depending on the amount of specific information that is available.

Performance monitoring and evaluation

An estimate is a prediction of the expected final cost of a proposed project and is therefore associated with uncertainty and probability of underruning or overrunning the predicted cost. This uncertainty necessitates the need for validation of the estimate by looking for errors and cross-checks on various cost drivers. Equally independent cost estimate should be compared with the predicted estimate and the difference reconciled.

References

Dysert, L. R. Estimating, Skills & Knowledge of Cost Engineering (5th ed.), (PP 9.1.-9.34) WV, AACE International

Developing a Point Estimate, GAO Cost Estimating and Assessment Guide (February 2005.), (PP. 107-123) Washington, DC, retrieved from http://www.gao.gov/cgi-bin/getrpt?GAO-05-325SP .

Humphreys, G. C. (2011). Estimate Development, Project Management Using Earned Value (2nd ed.), (PP. 401-417) CA, Humphreys & Associates Inc.

Project Management Estimating Tools & Techniques, Project Management Guide retrieved from http://www.projectmanagementguru.com/estimating.html.

Giammalvo P. D. Activity Based Cost Management, AACE Certification Preparatory Course-Day 5

W11_Reginald Nwachukwu_ Comparing Basic Tools for Constructing Bar Chart


1. Problem Definition or Opportunity Statement:

To evaluate available tools for constructing a simple Bar Chart

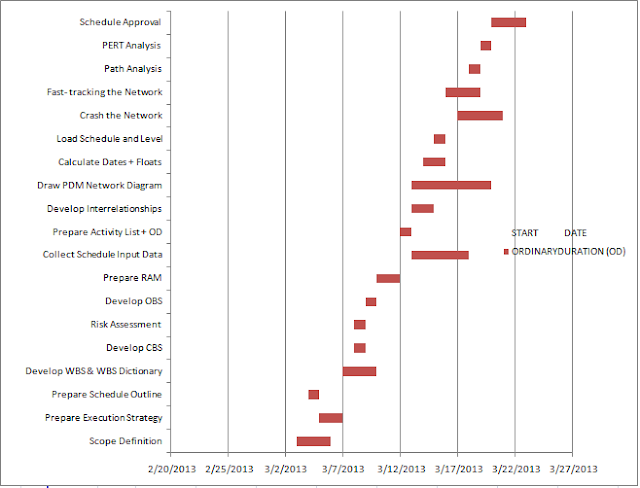
The Project team lead for a scheduling team have asked the me to construct a Bar Chart to establish the overall tasks necessary to complete proposed scheduling job. The Bar Chart is to initially represent all activities required to complete the preparation of schedule for a project. The activity list is as shown in the table below. 

Table 1 Activity List with relationships and duration


2. Development of Feasible Alternatives:

The alternatives that  be developed for the construction of Bar Chart is to used available computer tools which includes;

(a.) Excel
(b) Microsoft Project
(c) Primevera P6 ( N/A)

3. Development of Outcome for Each Alternative:

The expect outcome for each alternative tool is to produce a Bar Chart that can provide additional information to the project team when used as a scheduling tool. The main feature to produce a Bar Chart that shows how activities are interrelated (logic) and possible show the shortest possible path(s) through that activities necessary for its completion.

4. Selection of Acceptable Criteria:

To accept a tool that meets the required objective for constructing Bar Chart, the tool selected will represent activities, their relationships and duration. These data are necessary to plan, monitor and control the scheduling task using Bar Chart.

5. Analysis and Comparison of Each Alternative:

Using the activity list and duration table, Bar Charts for the proposed scheduling tasks were constructed using the Excel  and Microsoft Project. The focus is to construct and "automated" Bar Chart that represents the schedule tasks and flexible to update and control. Figure 2 is the Bar Chart using Excel and have limited features apart from representing activities and on a time-phased scale. It does not depicts any feature or relationships between activities. Figure 3 represents Bar Chart constructed from Microsoft Project. It is a modified Bar Chart that shows activities, relationships and their durations.

Figure 2 Bar Chart constructed from Microsoft Excel 2007


Figure 3 Bar Chart constructed from Microsoft Project 2007


6. Selection of Preferred Alternative:

From the results of Bar Charts presented, Microsoft Project will be a better tool for scheduling Bar Chart for the schedule project and will provide more informations between activities and their relationships 


7. Performance Monitoring and Evaluation of Results:

Performance of the Bar Chart will be evaluated and reported as it prove to be a valuable tool for the schedule team necessary to complete their tasks by observing and monitor activities represented on the Bar Chart.

References:

1. Humphreys G.C. (2002) Project Management Using Earned Value (2nd Edition) pp. 143 - 144 Orange CA Humphreys & Associates

2. Brassard, M. & Ritter D. (2010). Chapter 1 Gantt Chart (pp.9). The Memory Jogger 2 (2nd edition). USA:GOAL/QPC

3. Learning Services IT Guides : Gantt Chart in Microsoft Project 2010  Retrieved from:

Wednesday, February 27, 2013

W17_Austin_Competencies-Based Development (CBD) Profile in Project Management

1.    Problem recognition, definition and evaluation
For effective and efficient implementation of RAM in Project management, it is important that job competencies requirements are added to individuals’ roles and responsibilities, matching an employee to a position based on his competence, behavioral characteristics, personality attributes and individual aptitudes.
Hence, the problem statement is to determine the best criteria for Roles and Responsibility Assignment in Project Management.

2.    Development of the feasible alternatives
From a responsibility assignment matrix perspective, there are two different kinds of core competencies: position-specific and organizational. However, individuals’ core competencies are determined by the following factors; skills, knowledge, technical qualifications, behavioral characteristics, personality attributes and individual aptitudes.
3.    Development of the outcomes and cash flows for each

4.    Selection of the acceptable criteria
Using core competencies such as behavioral characteristics and personality attributes to drive the roles and responsibility assignment matrix process will provide more relevant information upon which to base resource allocation decisions than matching roles and responsibility against skills, knowledge and technical qualifications only.


5.  Analysis and Comparison of the alternatives
While traditional responsibility assignment matrix focuses primarily on evaluating individuals skills, knowledge and technical qualifications, but a competency-based approach includes an analysis of individuals  behavioral characteristics as well as personality attributes.

6.    Selection of the preferred alternative
Competency-based approach is grounded in the identification of core competencies required for success and the subsequent evaluation of individuals’ demonstration of those competencies in their past experiences. We recommend using behavioral characteristics, personality attributes and individual aptitudes in assigning roles and responsibilities that may require a demonstration of specific competencies based on past experiences, on the premise that "past experiences predicts future excellence." Research and experience have found behavioral attributes to be a more effective way of gauging how each personnel has performed in certain types of situations and therefore how successful each may be in a certain role.
7.    Performance Monitoring and Post Evaluation of Results
Adopting a competency-based responsibility assignment model requires an investment of time and effort up front, but that investment is well worth the effort because it enables you to make more appropriate management decisions. Responsibility assignment based on core competencies such as behavioral characteristics and personal attributes continue to be useful in setting goals and positioning new roles for success, identifying areas for professional development, and making appropriate decisions about future promotions and raises. These factors lead to increased employee engagement and retention, two hallmarks of successful organizations.
8.    References/Bibliography
1.    Humphreys, G. C. (2011). Project Management Using Earned Value (2nd ed. Chap 4 P.91-P.110-Responsibility Assignment Martix Case study). Humphreys & Associates, Inc. Retrieved from: http://www.humphreys-assoc.com/evms/project-management
2.    Thomas, F. Lyons (2012). Levels in Organizations and Role Clarity.Role clarity, need for clarity, satisfaction, tension, and withdrawal. Retrieved from:
3.    A Guide to the Project Management Body of Knowledge (PMBOK Guide). PMI Standards Committee, Project Management Institute. 2010. ISBN 1-933890-66-5.

smallbusiness.chron.com/pros-cons-competency-... - United StatesCachedShare
Shared on Google+. View the post.
You +1'd this publicly. Undo
One option is a competency-based plan, which rewards individuals based on how well they perform in relation to general attributes, such their ability to multitask, ...