1.
Problem recognition, definition and evaluation
This week case study is to evaluate the non-probabilistic techniques
for dealing with risk and uncertainties associated with Housing Estates Development
Projects in Nigeria and determine investment
decisions under uncertainty and risk situations.
2.
Development of the feasible alternatives
Some of the methods used for investment
decisions under uncertainty and risk situations includes; Break-even Analysis, Spider
Graph and Tornado Chart.
1. Break-even Analysis – Breakeven analysis determines the value of a critical factor
at which economic trade-offs are balance. When the selection between mutually
exclusive housing projects alternatives (or outcomes) is heavily dependent on a
single value basis for selection, which is known as the breakeven point, where return
on investment (or annual savings) offsets initial investment costs.
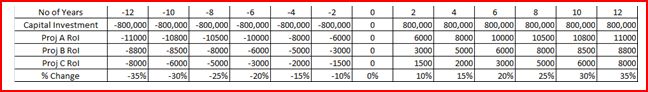
2. Spider Graph – This approach makes explicit the impact of variability in the
estimates of each factor of concern on the economic measure of merit. The table
below demonstrates this technique by plotting the results of changes in the
estimates of several factors, separately, on the PW (Present Worth) of the
Housing Estate Development projects.
3. Tornado Chart – It’s a bar chart commonly used to compare characteristics of mutually
exclusive alternatives defined as a group of projects from which, at most, one
project may be selected. It helps
visualize investment risks and uncertainties, such as; Budget availability,
Timely delivery, Quality, Standard and Strategy.
3.
Development of the outcomes and cash flows for each Alternative
a.
Using breakeven chart for the feasible alternatives dependent on a
function of their location. Consider
a housing development projects (50 units of three bed-rooms each), mutually exclusive
and comparably located as shown below:

To find the breakeven point for the selection
of the mutually exclusive housing estates development projects alternatives
(outcomes), where Return on Investment (annual
savings), offsets Initial Investment.

In this case study, we
develop Equivalent Uniform Annual Cost (EUAC) expressions for each of the
housing estate development project location.
Assume minimum attractive rate of return (MARR) =
15% and a study period of 10 years. By default, we also assume the maintenance
costs of the housing estates development alternatives (outcomes) as well as the
future resale value will be the same.
|
Hence, the breakeven points, using the EUAC
metrics is as follows;
|
|
EAUC (15%) = Initial investment (A/P, 15%, 10) +
Annual maintenance + Annual Rate of Return:
|
|
Thus for Location A: EAUC (15%) = 20,000 (A/P, 15%, 10) + 70% = 24,012
|
|
Thus for Location B: EAUC (15%) = 15,000 (A/P, 15%, 10) + 60% = 16,219
|
|
Thus for Location C: EAUC (15%) = 10,000 (A/P, 15%, 10) + 50% = 12,323
Based on the best
estimates of the average Returns on Investment (annual savings) with MARR = 15% and a study period of 10 years,
Housing development project with the lowest cost or greatest savings should
be given the highest priority.
a.
Using
Spider Graph to determine how
sensitive the decision to invest in the housing estates development projects,
dependent on the estimates of investment costs and returns on investments
(annual savings).
With
reference to Sensitivity Analysis using Spider Graph on P.484 EE
a.
Using Tornado Chart to examine
possible cash flows and returns on an investment when one uncertain element is altered. It helps
visualize investment risks and uncertainties, such as; Budget availability,
Timely delivery, Quality, Standard and Strategy:

As shown
above, the varying NPVs of a housing estate development project, dependent
on an initial investment valued at $8 billion (the point where the vertical
axis crosses), subject to uncertainties.
In this case
study, Budget availability is the largest uncertainty; with 25%
uncertainty, the project’s NPV would drop to N4 billion, from the
base case of N8 billion. On the other hand, if uncertainties increase to 35%,
we have a large upside and the NPV would be N12 billion. However, If
it goes down to 20,500 the NPV would reduce to N5 billion. However, if
we can raise budget up to 29,500 due to a favourable competitive environment,
then the upside is N4 billion from the base case.
1.
Selection of the acceptable criteria
In our estimates of the
average Returns on Investment (annual savings) with MARR = 15% and a study period of 10 years, Housing
development project with the lowest cost or greatest savings should be given the highest priority,
as shown in the breakeven analysis.
The sensitivity
of the decision to invest in the housing estates development projects is dependent
on the estimates of investment costs and returns on investments (annual
savings), as depicted in the spider graph.
Possible cash
flows and returns on investment are dependent on the degree of alteration or variation
of one uncertain element or risk impact, as illustrated with the tornado chart.
5. Analysis and Comparison of feasible alternatives
Based on above analysis, our best estimates of the average Returns on
Investment (annual savings) with MARR = 15% and a study period of 10 years, Housing development project with the lowest cost or greatest savings should be
given the highest priority in the following order of preference:
·
Project Location A
·
Project Location B
·
Project Location C
6.
Selection of the preferred alternative
Based on our best estimates of the average Returns
on Investment with MARR =
15% and a study
period of 10 years, Housing development project location A is found to
be more economical, with favourable Returns on Investment.
7.
Performance Monitoring and Post Evaluation of Results
Performance monitoring and post evaluation of
results using sensitivity analysis shall be based on best estimates of investment costs and returns on investments
(annual savings). Having looked at the marginality of feasible alternatives, the
management best choice of Housing development
project shall be
determined by the lowest cost and greatest
savings, starting from Project Location A, with favourable returns on
investment.
8.
References/Bibliography
1.
Sullivan, W. G. Wicks, E.M., & Koelling, C.P.
(2012). Engineering Economy, (15th ed.) [Chap. 11,
PP473 – PP499]. Breakeven and Sensitivity Analysis http://www.amazon.com/Engineering-Economy-15th-William-ullivan/dp/0132554909
2.
W22_TRI_ Sensitivity Analysis on Selected Gas
Project
3. Jovanović, P. J. (1999) International Journal of Project
Management, Evaluation of investment projects under uncertainty
and risk is possible to be carried out through. Sensitivity Analysis
of criteria for investment project evaluation is a very complex
procedure. Application of sensitivity analysis in investment project evaluation under uncertainty and risk
4.
Méndez-García, J. C. (1 Feb 2007). Tornado
Charts in Excel 2007 Update.
A tornado diagram, as
discussed in a previous entry, may provide a ...
You've visited this page 2 times. Last visit:
1/7/13 http://8020world.com/2007/02/easy-creation-of-tornado-charts-in-excel-5-steps-no-add-ins/
5.
A
spider chart is a graphical
method of displaying multivariate data in the form of a two-dimensional chart
of three or more quantitative variables represented on ... http://demos.dojotoolkit.org/demos/spiderChart/demo.html
|
AWESOME, Austin!!!! Love it!!!
ReplyDeleteIn the oil and gas sector, we often find Tornado Diagrams being used. In the oil and gas sector, what do you think is the most important factor impacting the decision to select a specific project? Second? Third?
See if you can find a "real" tornado diagram from one of the major oil companies. It makes for some very interesting analysis.
Keep up the good work, Austin!!
BR,
DR. PDG, Jakarta