Problem definition
Cost accounting is defined as the historical reporting of
disbursements and costs and expenditures on a project. When applied to a
current project assists in giving precise project status. What is the better
technique for cost accounting?
Feasible alternatives
Work breakdown structure (WBS)
Code of Accounts (COA)
Activity based Costing (ABS)
Develop the outcome of each
alternative
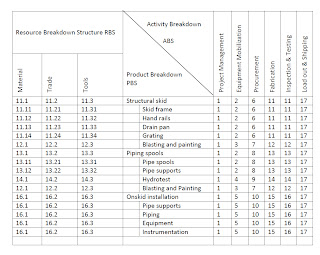
Table 1 3D WBS Matrix
2000 Assets 6000 Expences
2100 Cash 6100
Cost of products sold
2200 Accounts Receivable 6200
Salaries and wages
2300 Notes Receivable 6300
Heat, light, and power
2400 Inventory – materials and supplies 6400Communications expence
2500 Inventory – finished products 6500 Insurance
2600 Work-in-progress 6600
Insurance
2700 Equipment 6700
Taxes
2800 Buildings and fixtures 6800 Depreciation
2900 Land 6900
Interest expense
3000 Liabilities 7000
Project work in progress
3100 Accounts payable 7100
Structural skid
3200 Notes payable 7200
Piping works
3300 Accrued liabilities
3500 Reserve accounts
4000 Equity
4100 Retained earnings
5000 Reserves
5100 Sales of finished products
5200 Other revenue
Table 3 Typical Code of
Accounts
The attribute for the selection criteria is;
·
Cost visibility
·
Project visibility
·
Cost forecasts
Analysis of alternatives
Code of Accounts summarises costs around business
practices. It classifies various categories of costs incurred in the progress
of a job. It does not provide the visibility needed to manage the work or to
make informed forecasts of the cost of new jobs.
The ABC assigns resources to the activities that are
required to accomplish the cost objective. In this way resources and activities
that are cost drivers are known. Fig. 2 shows resources assignment to
activities.
The WBS matrix provides the framework for planning and
controlling the resources needed to accomplish the work and facilitates the
summary of project data regarding the cost and schedule performance cost. Fig. 3 shows matrix of resources, required to
carry out each activity to generate a product.
|
ATTRIBUTES
|
COA
|
ABC
|
WBS
|
|
Cost
Visibility
|
0
|
1
|
1
|
|
Project
Status
|
0
|
0.5
|
1
|
|
Cost
Forecast
|
0
|
0.5
|
1
|
|
|
0
|
2
|
3
|
Selection of preferred alternative
The WBS matrix provides a complete picture of the project
with the costs associated with each subtask broken down to various resource
costs. When used to classify and record costs, the WBS becomes the COST Element
Structure (CES) and fulfills both technical and cost functions. Table 1 above
shows that WBS provides cost visibility, project status and data for cost
forecasts.
Performance monitoring and evaluation
Historical cost records represent the way a company
conducts its business. Analysis of the cost data determines how the company has
performed and to forecast cost trends. A project cost baseline is developed and
is used as a basis of cost monitoring and control.
References
Postula, F. D. Cost Elements, Skills & Knowledge of
Cost Engineering (5th ed.), (PP 1.4-1.6) WV, AACE International
Humphreys, G. C. (2011). Definition of Scope, Work
Breakdown Structure (WBS) and Dictionary, Project Management Using Earned Value
(2nd ed.), (PP. 45-58) CA, Humphreys & Associates Inc.
Humphreys, G. C. (2011). Collecting Actual Cost, Project
Management Using Earned Value (2nd ed.), (PP. 531-543) CA, Humphreys
& Associates Inc.
Sullivan, W.G., Wicks, E.M., & Koelling, C.P. (2012).
Decision Making Considering Multiattributes, Engineering Economy (15th ed.), (PP 582-584)
New Jersey, NJ. Pearson Higher Education, Inc.


AWESOME, Charlie......
ReplyDeleteNice work following our 7 step process and a perfect job in citing your references using APA format.
Not anything else I can ask from you!!
BR,
Dr. PDG, Jakarta