The
offshore construction section of an IOC in Nigeria manages a portfolio of “Minor
Plant Modification” projects which are executed by “Local EPCI” contractors as
a policy. The number of change orders as well as claims on these projects is
unacceptable by management and the root cause(s) is/are to be investigated.
In
W2 posting, we were able to attribute this challenge partly to inadequate scope
definitions in “requests for proposals” developed in the division. For this week’s
posting (W3) we will try to confirm if the contractor selection process contributes
to this challenge. The assumption is that the selection process considers
predominantly, or only the commercial bids, using the “lowest bidder” criterion
which results in the selection of contractors with a potential of running into
financial problems as the project progresses. Hence the claims and change
orders.
For
this assessment, still based on the initial sets of bids for sixteen different projects,
we will compare the company estimates with the selected contractor bids using
the following statistical analyses:
1.
Find the coefficient of correlation
between the company estimates and the winning bids
Given by:

2.
Simple Linear Regression Analysis of
company estimates and selected bids.
Given by:

Where

3.
Find the Coefficient of
Determination (R2) of the regression model developed to determine
how well it describes the relationship between the estimates and the winning
bids

The table below shows the company estimates
and winning bids (adjusted by a factor) as well as the statistics calculated
from them.

Fig 1: Table of variables
and computations
From the table above we calculate the following:
1. r = 143,914685,467.77/ (SQRT134,397,903,535.55 * SQRT 169,077,491,094.27) = 0.95
2. m = 143,914685,467.77/134,397,903,535.55 = 1.07
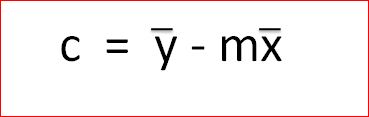
c = 181,122.98 – 1.07*189,879.52 = -22202.01
therefore
3. R2 = 154,105,355,429.21/169,077,491,094.27 = 0.91

Fig 2: Scatter Diagram of Company Estimates vs Winning/Selected Bids with Regression Line

Fig 3: Scatter Diagram of Company Estimates minus Winning/Selected Bids
1.)
r
>= |0.85| :reject assumption, otherwise accept
2.)
R2 >= |0.85|: reject
assumption, otherwise accept.
3.)
If charts do not indicate adequate relationship
between the two variables, accept assumption otherwise reject.
Our calculated parameters are as follows:
r = 0.95: therefore we reject the assumption
R2 =
0.91: therefore we reject the assumption
The chart of
differences between the variables shows that we have an equal number of points
plotted above and below 0. Based on this, we also reject the assumption
6. Select the Preferred Alternative
The
Coefficient of correlation (r) obtained indicates a strong relationship between
the two variables. The Coefficient of determination (R2) obtained indicates
that the linear regression model developed describes that data adequately. These
figures as well as the equal distribution of the differences above and below 0 implies that the lowest bidder criterion was
not the only bases for selecting bids as the selected bids exhibit the same
characteristics as the company estimates. So far, we have been able to identify
only insufficient information in the request for proposals as a root cause of
the unacceptable number of change orders and claims in the division’s minor
projects.
7. Performance Monitoring & Post
Evaluation of Result
Further studies will be carried out on the contractor bids
1. Kvanli, A. H., Pavur, R. J. & Guynes C. S. (2000). Introduction to Business Statistics. Chapter 14
2. Amos, S.J. (2007). Skills & Knowledge of Cost Engineering
Fifth Edition. Chapter 9
3. R-Squared. Retrieved from
http://www.hedgefund-index.com/d_rsquared.asp
AWESOME, Stephon!! Really interesting case study and very shortly, I hope to be able to share a book I am reviewing on this topic with you. Just haven't gotten it from the author yet.
ReplyDeleteWhile I don't see anything wrong with your numbers or the calculations, what I really would like to see you analyze in more depth is the DIFFERENCE between the owners bid and the contractors bid.
For your W4 posting, what I would like to see you do is take the data from Figure 3 and perform a Statistical Process Control (SPC) analysis on it. We need to find out what the mean is, and if there are any outliers indicating the process is out of control. (See Memory Jogger 2, pages 63-65)You would also be wise to read over pages 173-177 in Memory Jogger 2 as well.
I have a strong suspicion that what you will find out is there is something in the bidding process itself which is causing such wide differences. But let's analyze the numbers more to see if we can isolate the problem.
Keep up the good work Stephon, but please do catch up. I would like you to mentor some of your team members but I want you caught up before you do so. I expect mentors to be setting a good example- leading from the front...
BR,
Dr. PDG, Jakarta